-
Overview
Hennessy Cornerstone Mid Cap 30 Fund
Quantitatively managed, the Fund maintains a concentrated portfolio of mid-cap companies.
Investor
HFMDXInstitutional
HIMDXMorningstar style box

Overall morningstar rating
-
Investor
-
HFMDX
-
Institutional
-
HIMDX
Among 457 Small Value Funds (Based on risk-adjusted returns, as of 3/31/24)
 Investment Overview Video
Why Invest
- Concentrated portfolio of purely mid-cap stocks
- Quantitatively-driven, repeatable investment process
- Focus on undervalued companies that have proven sales and earnings growth
Investment Criteria
The Hennessy Cornerstone Mid Cap 30 Fund utilizes a quantitative formula to identify a concentrated portfolio of 30 domestic, common stocks with the highest one-year price appreciation that also meet the following criteria:
- Market capitalization between $1 and $10 billion
- Price-to-sales ratio below 1.5
- Annual earnings higher than the previous year
- Positive stock price appreciation over the past three- and six-month periods
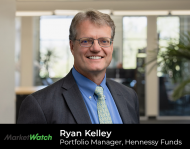
Portfolio Managers
-
 Chief Market Strategist and Portfolio Manager
-
21Years on Fund
-
44Years of Experience
-
-
 Chief Investment Officer and Portfolio Manager
-
7Years on Fund
-
28Years of Experience
-
-

“Sitting in the ‘sweet spot’ of the market, we believe mid-caps present a compelling investment opportunity.”
- Ryan Kelley
Share -
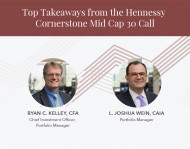
Insights & News
-
Performance
Daily Pricing & Performance
as of 5/3/24-
Investor Class (HFMDX)
-
NAV
$22.76
-
$ Change
$0.29
-
% Change
1.29%
-
YTD
15.24%
-
-
Institutional Class (HIMDX)
-
NAV
$23.99
-
$ Change
$0.30
-
% Change
1.27%
-
YTD
15.34%
-
Average Annualized Total Return
as of 4/30/24Name 1 Mo YTD 1 yr 3 yr 5 yr 10 yr Since Inception (9/17/03) Investor Class (HFMDX) -4.18% 12.66% 40.18% 15.05% 19.27% 11.50% 11.76% Institutional Class (HIMDX) -4.17% 12.74% 40.66% 15.45% 19.69% 11.88% 12.06% Russell Midcap® Index -5.40% 2.73% 16.35% 2.41% 9.06% 9.40% 10.21% S&P 500® Index -4.08% 6.04% 22.66% 8.06% 13.19% 12.41% 10.16% as of 3/31/24Name QTR YTD 1 yr 3 yr 5 yr 10 yr Since Inception (9/17/03) Investor Class (HFMDX) 17.57% 17.57% 40.89% 17.19% 20.71% 11.98% 12.04% Institutional Class (HIMDX) 17.64% 17.64% 41.39% 17.61% 21.15% 12.36% 12.35% Russell Midcap® Index 8.60% 8.60% 22.35% 6.07% 11.10% 9.95% 10.55% S&P 500® Index 10.56% 10.56% 29.88% 11.49% 15.05% 12.96% 10.43% Hypothetical Growth of $10,000
as of 4/30/2024Value of $10,000 invested between 4/30/2023 and 4/30/2024
Cornerstone Mid Cap 30 Fund (HFMDX) $14,018 Cornerstone Mid Cap 30 Fund (HIMDX) $14,066 Russell Midcap® Index $11,635 S&P 500® Index $12,266 Value of $10,000 invested between 4/30/2021 and 4/30/2024
Cornerstone Mid Cap 30 Fund (HFMDX) $15,227 Cornerstone Mid Cap 30 Fund (HIMDX) $15,387 Russell Midcap® Index $10,741 S&P 500® Index $12,620 Value of $10,000 invested between 4/30/2019 and 4/30/2024
Cornerstone Mid Cap 30 Fund (HFMDX) $24,130 Cornerstone Mid Cap 30 Fund (HIMDX) $24,565 Russell Midcap® Index $15,425 S&P 500® Index $18,582 Value of $10,000 invested between 4/30/2014 and 4/30/2024
Cornerstone Mid Cap 30 Fund (HFMDX) $29,707 Cornerstone Mid Cap 30 Fund (HIMDX) $30,740 Russell Midcap® Index $24,560 S&P 500® Index $32,206 Value of $10,000 invested between 9/17/2003 and 4/30/2024
Cornerstone Mid Cap 30 Fund (HFMDX) $98,981 Cornerstone Mid Cap 30 Fund (HIMDX) $104,703 Russell Midcap® Index $74,239 S&P 500® Index $73,516 This data illustrates the performance of a hypothetical $10,000 investment made in the Fund for the period noted, and it assumes reinvestment of dividends and capital gains. This chart does not imply future performance.
Calendar Year Total Returns
2014 2015 2016 2017 2018 2019 2020 2021 2022 2023 Investor Class (HFMDX) 16.44% 0.02% 5.82% 20.51% -22.78% 15.76% 23.37% 27.22% 2.79% 30.78% Institutional Class (HIMDX) 16.75% 0.23% 6.20% 20.96% -22.44% 16.02% 23.82% 27.76% 3.17% 31.27% Russell Midcap® Index 13.22% -2.44% 13.80% 18.52% -9.06% 30.54% 17.10% 22.58% -17.32% 17.23% S&P 500® Index 13.69% 1.38% 11.96% 21.83% -4.38% 31.49% 18.40% 28.71% -18.11% 26.29% Year Investor Class (HFMDX) Institutional Class (HIMDX) Russell Midcap® Index S&P 500® Index 2013 29.63% 30.06% 34.76% 32.39% 2012 14.10% 14.54% 17.28% 16.00% 2011 4.05% 4.42% -1.55% 2.11% 2010 27.26% 27.82% 25.48% 15.06% 2009 24.67% 25.13% 40.48% 26.46% 2008 -33.10% -32.92% -41.46% -37.00% 2007 6.69% 6.69% 5.60% 5.49% 2006 11.91% 11.91% 15.26% 15.79% 2005 32.74% 32.74% 12.65% 4.91% 2004 14.10% 14.10% 20.22% 10.88% Returns-Based Statistics
Relative to Russell Midcap® Indexas of 3/31/24Investor Class (HFMDX)Type 3 yr 5 yr 10 yr Alpha 10.59 8.26 1.63 Beta 0.98 1.15 1.11 Upside Capture 109.53 116.12 104.78 Downside Capture 72.39 87.96 96.94 Institutional Class (HIMDX)Type 3 yr 5 yr 10 yr Alpha 10.95 8.62 1.98 Beta 0.98 1.15 1.11 Upside Capture 110.21 116.65 105.55 Downside Capture 71.79 87.21 96.19 Alpha measures the fund’s excess return relative to the return of the benchmark. Beta measures the volatility of the fund compared to that of the benchmark. The beta of the benchmark is 1.00. Capture ratios measure the fund’s overall performance in up markets (positive return periods) and down markets (negative return periods).
Sharpe Ratio
as of 3/31/24Type 3 yr 5 yr 10 yr Investor Class (HFMDX) 0.71 0.77 0.57 Institutional Class (HIMDX) 0.73 0.78 0.59 Russell Midcap® Index 0.25 0.50 0.55 Small Value Category Average 0.23 0.43 0.37 Sharpe Ratio is a measure of risk-adjusted return, reflecting the average return earned in excess of the risk-free rate per unit of volatility.
Standard Deviation
as of 3/31/24Type 3 yr 5 yr 10 yr Investor Class (HFMDX) 21.65 26.73 21.42 Institutional Class (HIMDX) 21.67 26.73 21.41 Russell Midcap® Index 19.50 21.18 17.26 Small Value Category Average 19.82 24.52 20.27 Standard deviation is a statistical measure of the historical volatility of a mutual fund or portfolio.
Fund Expenses
-
Investor Class (HFMDX)
-
Gross expense ratio
1.34%
-
-
Institutional Class (HIMDX)
-
Gross expense ratio
0.97%
-
Performance data quoted represents past performance; past performance does not guarantee future results. The investment return and principal value of an investment will fluctuate so that an investor's shares, when redeemed, may be worth more or less than their original cost. Current performance of the fund may be lower or higher than the performance quoted.
The performance shown for Institutional Class shares / HIMDX prior to 3/3/08 represents the performance of Investor Class shares of the Fund and includes expenses that are not applicable to and are higher than those of Institutional Class shares.
Morningstar Proprietary Ratings reflect risk-adjusted performance as of 3/31/24. The Morningstar Rating™ for funds, or "star rating", is calculated for managed products (including mutual funds, variable annuity and variable life subaccounts, exchange-traded funds, closed-end funds, and separate accounts) with at least a three-year history. Exchange-traded funds and open-ended mutual funds are considered a single population for comparative purposes. It is calculated based on a Morningstar Risk-Adjusted Return measure that accounts for variation in a managed product's monthly excess performance, placing more emphasis on downward variations and rewarding consistent performance. The top 10% of products in each product category receive 5 stars, the next 22.5% receive 4 stars, the next 35% receive 3 stars, the next 22.5% receive 2 stars, and the bottom 10% receive 1 star. The Overall Morningstar Rating™ for a managed product is derived from a weighted average of the performance figures associated with its three-, five-, and 10-year (if applicable) Morningstar Rating™ metrics. The weights are: 100% three-year rating for 36-59 months of total returns, 60% five-year rating/40% three-year rating for 60-119 months of total returns, and 50% 10-year rating/30% five-year rating/20% three-year rating for 120 or more months of total returns. While the 10-year overall star rating formula seems to give the most weight to the 10-year period, the most recent three-year period actually has the greatest impact because it is included in all three rating periods. Institutional Class (HIMDX) received 5 stars for the three-year, 5 stars for the five-year and 5 stars for the ten-year periods ended 3/31/24 / Investor Class (HFMDX) received 5 stars for the three-year, 5 stars for the five-year and 5 stars for the ten-year periods ended 3/31/24 among 457, 426 and 335 Small Value Funds, respectively. Each share class is counted as a fraction of one fund within this scale and rated separately, which may cause slight variations in distribution percentage.
Each Morningstar category average represents a universe of funds with similar objectives. The Morningstar Style Box reveals the fund's investment style as of 3/31/24. The vertical axis shows the market capitalization of the stocks owned and the horizontal axis shows investment style (value, blend, or growth). ©Morningstar, Inc. All Rights Reserved. Past performance is no guarantee of future results.The Russell Midcap® Index is an unmanaged index commonly used to measure the performance of U.S. medium-capitalization stocks. The S&P 500® Index is an unmanaged index commonly used to measure the performance of U.S. stocks. One cannot invest directly in an index.
Standard & Poor’s Financial Services is the source and owner of the S&P® and S&P 500® trademarks.
Frank Russell Company (“Russell”) is the source and owner of the trademarks, service marks, and copyrights related to the Russell Indexes. Russell® is a trademark of Russell. Neither Russell nor its licensors accept any liability for any errors or omissions in the Russell Indexes or Russell ratings or underlying data, and no party may rely on any Russell Indexes or Russell ratings or underlying data contained in this communication. No further distribution of Russell data is permitted without Russell’s express written consent. Russell does not promote, sponsor, or endorse the content of this communication.
Fund holdings and sector allocations are subject to change and should not be considered a recommendation to buy or sell any security.
-
-
Portfolio
Portfolio Characteristics
as of 3/31/24Inception Date (HFMDX) 9/17/03 Inception Date (HIMDX) 3/3/08 Total Fund Assets $991 Million Active Share vs. Russell Midcap® Index 99% Portfolio Turnover 89% Median Market Cap $5.0 Billion Median Price/Earnings 20.3x Median Price/Book 3.9x Median Price/Sales 1.0x Price/Earnings measures a stock’s price per share compared to earnings. Price/Book measures a stock’s price per share to book value. Price/Sales measures a stock’s price per share to revenue. Portfolio Turnover, Price/Earnings, and Price/Sales shown reflect the trailing 12-month period.
Sector Weighting
as of 3/31/24Fund Russell Midcap® Index Difference Industrials 36.6% 20.3% +16.3% Consumer Discretionary 23.1% 10.7% +12.4% Energy 20.3% 5.0% +15.3% Consumer Staples 6.9% 3.4% +3.4% Information Technology 4.7% 13.1% -8.4% Materials 2.6% 5.8% -3.1% Communication Services 2.3% 3.2% -0.9% Financials 0.9% 16.1% -15.2% Utilities 0.0% 5.1% -5.1% Health Care 0.0% 9.9% -9.9% Real Estate 0.0% 7.4% -7.4% Cash & Other 2.5% Portfolio Holdings
Top 10 Holdings
as of 3/31/24Top 10 Holdings % of Net Assets Gap, Inc. 6.4% Abercrombie & Fitch Co. 5.4% Modine Manufacturing Co. 5.1% Comfort Systems USA, Inc. 4.6% EMCOR Group, Inc. 4.1% XPO , Inc. 3.9% Sprouts Farmers Market, Inc. 3.7% Sterling Infrastructure, Inc. 3.7% Parsons Corp. 3.7% Guess?, Inc. 3.6% Total as % of Net Assets 44.0% Total Holdings: 31
as of 3/31/24Equity Holdings % of Net Assets Gap, Inc. 6.4% Abercrombie & Fitch Co. 5.4% Modine Manufacturing Co. 5.1% Comfort Systems USA, Inc. 4.6% EMCOR Group, Inc. 4.1% XPO , Inc. 3.9% Sprouts Farmers Market, Inc. 3.7% Sterling Infrastructure, Inc. 3.7% Parsons Corp. 3.7% Guess?, Inc. 3.6% Kyndryl Holdings, Inc. 3.5% Coca-Cola Consolidated, Inc. 3.2% Oshkosh Corp. 3.2% Applied Industrial Technologiees 3.0% Fluor Corp. 2.9% Flowserve Corp. 2.8% Plains GP Holdings LP (Class A) 2.8% Liberty Energy, Inc. 2.8% PBF Energy, Inc. 2.8% EnLink Midstream, LLC 2.8% Group 1 Automotive, Inc. 2.7% Carpenter Technology Corp. 2.6% Par Pacific Holdings, Inc. 2.6% MillerKnoll, Inc. 2.5% California Resources Corp. 2.4% MSC Industrial Direct Co., Inc. 2.4% Cinemark Holdings, Inc. 2.3% Oceaneering International, Inc. 2.2% CONSOL Energy, Inc. 2.0% NCR Voyix Corp. 1.2% NCR Atleos Corp. 0.9% Total as % of Net Assets 97.5% Cash & Other Holdings % of Net Assets Cash & Other 2.5% Total as % of Net Assets 2.5% Country Allocation
as of 3/31/24-
United States
97.5%
-
Cash & Other
2.5%
United States 97.5% Cash & Other 2.5% -
-
Distributions
The Hennessy Cornerstone Mid Cap 30 Fund pays capital gains (if any) once annually, usually in December. Ordinary income distributions (if any) are paid annually, usually in December.
Date Paid Income Short-Term Gain Long-Term Gain Total Per Share Reinvest Price 12/07/2023 -- -- $1.89834 $1.89834 $18.63 12/08/2022 -- -- $3.60395 $3.60395 $17.05 12/29/2021 $0.33969 -- -- $0.33969 $19.71 12/07/2018 -- $0.15008 $4.34596 $4.49604 $11.60 12/07/2017 -- -- $3.66211 $3.66211 $19.17 12/07/2016 -- -- $0.12486 $0.12486 $20.31 12/29/2015 $0.02570 -- -- $0.02570 $18.93 12/09/2015 -- $0.14238 -- $0.14238 $19.13 12/08/2014 -- -- $1.13945 $1.13945 $18.68 12/31/2013 $0.01748 -- -- $0.01748 $17.04 12/10/2013 $0.03064 -- $1.26111 $1.29175 $16.81 12/31/2012 $0.18367 -- -- $0.18367 $14.17 11/29/2007 -- $0.10246 $1.91402 $2.01648 $11.19 11/28/2006 -- -- $0.09968 $0.09968 $12.40 11/17/2005 -- -- $1.61196 $1.61196 $11.12 Past performance is not a guarantee of future results.
Download historical distributions and NAVsDate Paid Income Short-Term Gain Long-Term Gain Total Per Share Reinvest Price 12/07/2023 -- -- $1.99820 $1.99820 $19.61 12/08/2022 -- -- $3.77950 $3.77950 $17.88 12/29/2021 $0.35150 -- -- $0.35150 $20.60 12/07/2018 -- $0.15336 $4.44097 $4.59433 $11.99 12/07/2017 -- -- $3.77322 $3.77322 $19.68 12/07/2016 -- -- $0.12776 $0.12776 $20.78 12/29/2015 $0.06342 -- -- $0.06342 $19.31 12/09/2015 -- $0.14547 -- $0.14547 $19.55 12/08/2014 -- -- $1.16167 $1.16167 $19.04 12/31/2013 $0.06065 -- -- $0.06065 $17.33 12/10/2013 $0.03064 -- $1.26111 $1.29175 $17.13 12/31/2012 $0.23557 -- -- $0.23557 $14.38 Past performance is not a guarantee of future results.
Download historical distributions and NAVs -
Fund Documents
Download PDF View Online Cornerstone Mid Cap 30 Fund Documents Fact Sheet Portfolio Perspective View Summary Prospectus Full Prospectus Statement of Additional Information Cornerstone Mid Cap 30 Fund Shareholder Reports and Quarterly Holdings Q1 Holdings Semi-Annual Report Q3 Holdings Annual Report Currently, paper copies of the annual and semi-annual reports are not sent by mail unless shareholders specifically request paper copies. You may elect to receive paper copies free of charge by calling U.S. Bank Global Fund Services at 1-800-261-6950 or, if you own shares through a financial intermediary, by contacting your financial intermediary.
**Please note the upcoming change to shareholder report delivery.**
After July 24, 2024, shareholder reports will be sent by mail unless a shareholder has elected or elects to receive reports electronically via e-delivery. To sign up for e-delivery, please visit My Account. https://www.hennessyfunds.com/account or by calling U.S. Bank Global Fund Services at 1-800-261-6950 or, if you own shares through a financial intermediary, by contacting your financial intermediary.